Jeffrey Perkel

About Jeffrey Perkel

Jeff is the DXS tech editor and a recovering scientist who has always had a passion for the technology and the gadgetry of science. He has been a scientific writer and editor since 2000, when he left academia to join the staff of The Scientist magazine as a Senior Editor for Technology. Before that, he studied transcription factor biology at the University of Pennsylvania and Harvard Medical School — training that, surprisingly, has little application in the real world. In 2006, he and his family headed west to Pocatello, Idaho, and has been a freelance writer ever since. You can see why Double X Science is thrilled to have him on the team!

How pregnant are you? Let’s find out

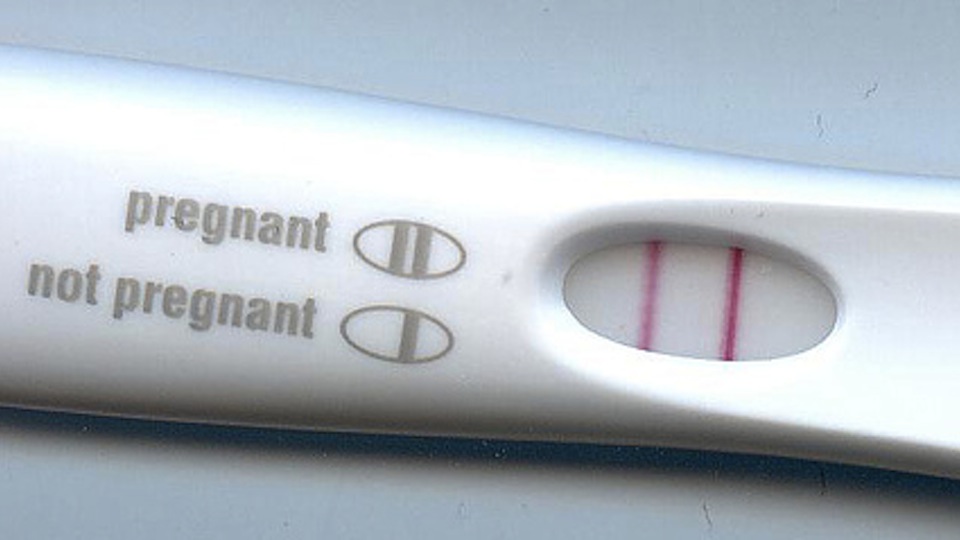
There’s an old saying: You can’t be a little bit pregnant. Pregnancy is what you might call a binary condition – you either are with child, or you’re not. Home pregnancy tests embody this thinking. You pee on the end of a stick, and three minutes later you either do or do not see a line in the results window. Congratulations, you’re expecting!

Biologically, of course, things are a bit more complicated. Pregnancy tests check for the presence of a particular protein, human chorionicgonadotropin (hCG), that is also elevated in women with breast and ovarian cancers. As a result, it’s sometimes useful to be able to quantify the levels of hCG – or any other so-called “biomarker” – with a bit more precision. A new diagnostic device, developed by a team of Texas researchers and described in the journal Nature Communications, enables precisely that.
The team developed what’s called a microfluidic device, a circuit of tiny channels etched into glass (or sometimes plastic or a rubber polymer) that enable researchers to run chemical assays on tiny volumes of sample. That’s helpful when the sample is particularly precious or hard to come by – a drop of blood from a newborn baby, say.
Microfluidic devices, sometimes called “lab-on-a-chip” devices (because they resemble computer chips in both design and size), are popular in both drug development companies and research laboratories, as well as in the clinic. Their reduced volumes and size mean they use less reagent volumes (making them relatively inexpensive) and produce less waste. They are also faster and higher throughput than many traditional experiments, and are easily automated.
The downside is in the data output. To read the results of a microfluidic assay, researchers generally need some large and expensive piece of hardware that can, for instance, interrogate the chip with a laser to measure fluorescence intensity. That requirement isn’t a problem for most research labs, but it does reduce the likelihood that the technology can be adopted by your general practitioner. And it makes the development of microfluidics-based home tests, analogous to a home pregnancy kit, all but impossible.(*)
To circumvent these problems, the Texas team used a clever “SlipChip” design. A SlipChip is a microfluidic device formed by overlaying two glass plates, whose channels can form either of two flow paths depending on the position of the top plate relative to the bottom. In one configuration, the channels flow left-to-right; in the other (that is, after sliding or “slipping” the top plate), they flow bottom-to-top. Samples and reagents are loaded in one configuration, and the chip is “slipped” to start the readout process.
The SlipChip design
Source: Nat. Commun. 3:1283 doi: 10.1038/ncomms2292 (2012).
Here’s how the authors describe it:

In the SlipChip, two pieces of glass etched with microfluidic wells and channels are assembled together in the presence of mineral oil. A fluidic path is formed when the two plates aligned in a specific configuration. Samples or reagents are preloaded through drilled holes using a pipette, and the top plate is then moved relative to the bottom plate to enable the diffusion and reaction of samples or reagents.

This video shows how it works.

The team calls its device a “volumetric bar-chart chip,” or V-Chip. The V-Chip runs what’s called an ELISA (enzyme linked immunosorbent assay), which is the gold standard in biomarker quantitation tests. Normally ELISAs are read with some sort of instrument that can measure either color, fluorescence, or chemiluminescence. The V-Chip is far simpler (albeit, less quantitative).
It uses an enzyme called catalase to degrade hydrogen peroxide into oxygen gas in volumes proportional to the molecule of interest – in this case, hCG. That gas, in turn, forces a column of red dye upwards to a height determined by the hCG concentration. (See the V-Chip in action here.) The result is a easy to read, microfluidic bar graph, with the height of each bar indicating not only if a woman is pregnant, but just how much hCG is in her urine. In a comparison against a commercial home pregnancy test, the V-Chip was more sensitive at low hCG concentrations, and more accurate at very high concentrations.
The V-Chip’s design is flexible, the authors note, and can be used to test either a large number of samples for a single molecule (as might be done in a clinical trial) or a single sample for multiple molecules, as in cancer screening. The current design allows as many as 50 parallel fluidic channels, meaning up to 50 molecules could be tested in parallel. In one experiment, the team used a six-channel design to test a panel of breast cancer cell lines for the abundance of three proteins (estrogen receptor, progesterone receptor, and human epidermal growth factor receptor) commonly found on breast cancer cells.
The simplicity of the test means it should be possible to design a device that can be used at home or in a doctor’s office. It is cheap, fast, and requires no special hardware. That means it could be used in areas lacking access to top-shelf medical care. It could even be used in the absence of a physician altogether. “The bar chart could be captured as an image using a smart phone, similar to a barcode reader and transmitted to a cloud computer for instant medical suggestions in the future,” the authors write. Now, how cool would that be?(*) That’s not entirely true. Harvard researcher George Whitesides has figured out a way to print microfluidic circuits onto paper, resulting in very simple and inexpensive designs. Boston-based Diagnostics For All is developing such tests for use in third world countries.

The Bright Crystal

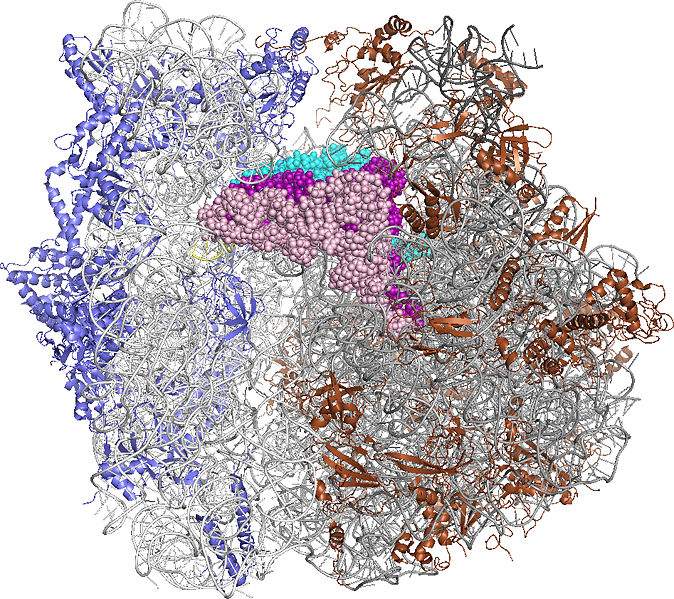
The crazy-complicated structure of the ribosome, solved by x-ray crystallography (Source)
Drug development used to be accomplished by the chemical equivalent of what you might call the spaghetti method: Throw a bunch of molecules against the wall and see what sticks. More recently, pharmaceutical companies have applied a more rational approach, using the molecular structures of drug targets to design molecules that “fit” them like a lock to a key.
The technique most often used to solve those molecular structures is x-ray crystallography. With this approach, which turned 100 years old in November, a high-powered beam of x-rays is shot at a crystal of protein molecules. The x-rays collide with the crystal’s atoms, scattering at specific angles. Working backwards from that information, researchers can figure out the original structure.
Over at Boing Boing, Maggie Koerth-Baker recently came up with a really fantastic analogy to explain this idea. X-ray crystallography, she wrote, is

… a method of determining the shape and structure of things that we can’t see with our own eyes. Imagine that you have captured Wonder Woman’s invisible airplane. You can’t see it. But you know it’s there because when you throw a rubber ball at the space, the ball bounces back to you. If you could throw enough rubber balls, from all different sides, and measure their trajectory and speed as they bounced back, you could probably get a pretty good idea of the shape of the plane.

(Source)
Anyhoo, as the name of the technique implies, the key to crystallography is, well, crystals. But not all proteins crystallize, and even with those that do, it can be hard to grow crystals large enough for the technique to work.
Recently, though, a pair of technology developments have made it possible (in some cases) to work around these problems.

The first development was the commissioning in the past few years of ultra-bright x-ray sources in California (the Linac Coherent Light Source at Stanford) and Japan. These so-called “x-ray free electron lasers” (X-FELs) shoot incredibly bright, incredibly short x-ray pulses, pulses that are so intense that they destroy a sample in a fraction of a second, but not before the x-rays (which travel at the speed of light, natch) have bounced off of it.

The reason crystals are required in crystallography is that any one diffraction event is hard to see. The regularly spaced molecules inside a crystal amplify that relatively weak signal, simplifying detection and structure determination. As it turns out, the brighter an x-ray source, the smaller the crystal required to obtain such data has to be, and with X-FELs, the crystals can be very small indeed – on the order of millionths of a meter (micrometers) in size, and perhaps even smaller.

Which brings me to the second development. In the March issue of the journal Nature Methods, a team of researchers led by Michael Duszenko in Germany showed that some proteins that cannot crystallize in a test tube will crystallize inside insect cells. Protein chemists often use cells as molecular factories to obtain large quantities of protein. But the goal is to extract the protein from the cells, not have them crystalize inside of them. Generally speaking, protein crystallization inside cells is a bad thing, the kind of thing researchers really don’t want to see; Duszenko and his team are the first to capitalize on this so-called “in vivo crystallization” phenomenon.

The crystals Duszenko’s team collected are quite small, of course –- they fit inside cells, after all — and in that initial study, they were on the order of 1 micrometer wide and 15 micrometers long. But as it turns out, they are big enough for the X-FEL. In the March paper, the team showed that these crystals will diffract x-rays in the X-FEL, but they didn’t solve the resulting structure.

Now, in a paper published Nov. 29 in Science, they have. They did it by combining X-FEL and in vivo crystallization to solve the structure of a trypsanosomal enzyme called cathepsin-B, a potential drug target for African sleeping sickness.

The team sprayed a stream of tiny enzyme crystals (each about 1 x 1 x 11 micrometers) into the path of the X-FEL, which fired discrete pulses of x-ray, each just 40 femtoseconds, or 0.000000000000040 seconds long, 120 times per second. Every so often, one of those pulses would collide with a crystal, and a nearby camera would capture the event.
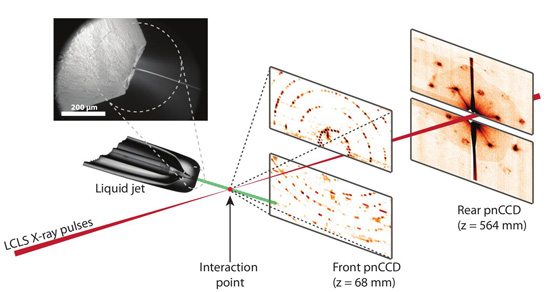
Serial femtosecond crystallography (Source Continue reading

Tiptoe through the thalamus…

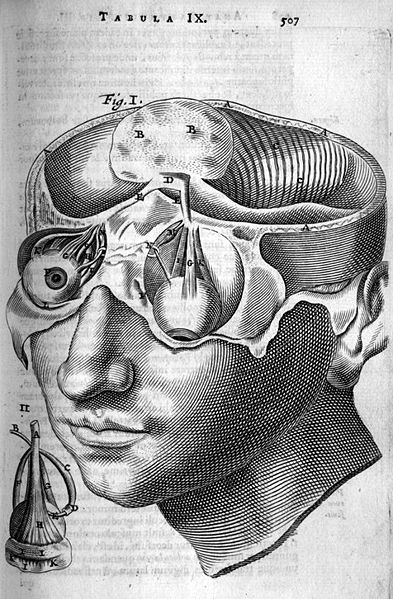
This is how people looked at the brain in 1673. Things have changed.
Sketch by Thomas Bartholin, 1616-1680.
Image via Wikimedia Commons. Public domain in USA.
In early October, the Allen Institute for Brain Science dropped a metric buttload of brain data into the public domain.
Founded by Microsoft co-founder Paul Allen, the Allen Institute for Brain Science is, not surprisingly, interested in, um, the brain. Specifically, according to the Institute’s web site, its mission is
“to accelerate the understanding of how the human brain works in health and disease. Using a big science approach, we generate useful public resources, drive technological and analytical advances, and discover fundamental brain properties through integration of experiments modeling and theory.”
Towards that end, researchers at the Allen Institute have been mapping gene expression patterns in the human and mouse brains, as well as neural connectivity in the mouse brain. Why? Well, because as a general rule, science requires a control. If scientists are ever to understand the brain – how we think, how we learn, how we remember things, and how all those processes get scrambled during disease or trauma – they first must understand what a typical baseline brain looks like. The Allen Institute is doing the heavy lifting of mapping out these datasets, one brain slice at a time.
In particular, they are mapping the gene expression and neural connectivity of every part of the brain, so that researchers can identify difference between regions, as well as the physical links that tie them together. Differences in gene expression patterns may reveal, for instance, that seemingly related regions actually have different functions, while connectivity, or brain “wiring,” could shed light on how the brain works.
I’m a technology nut, so I’m less interested in the answers to these questions than in how we arrive at them. And thanks to the Allen Institute, I (and you) can view these data from the luxury of my very own laptop, no special equipment required. (To be clear, you can’t view the data from my laptop. You’d need my computer, and you can’t have it.) You don’t even need to be a brainiac (I couldn’t help myself) to do it.
Here’s how. Point your browser to http://www.brain-map.org/. From there, choose a dataset – say, “Mouse Connectivity.” This is a dataset of images created by injecting fluorescent tracer molecules into the brains of mice, waiting some period of time, then sacrificing the mice, cutting their brains into thin slices — picture an extremely advanced deli slicer — and taking pictures of each one to see where the tracer material went. The result is a massive collection of images, collected by injecting hundreds of mice, preparing thousands of brain slices, and represents gigabytes upon gigabytes of data, which Allen Institute researchers have then reconstructed into a kind of virtual 3D brain.
In the parlance of neuroscientists, this dataset represents a first-pass attempt at a “connectome” – a brain-wide map of neural connections. But it’s definitely not the last; the connectome is vast beyond reckoning. According to one estimate,
Each human brain contains an estimated 100 billion neurons connected through 100 thousand miles of axons and between a hundred trillion to one quadrillion synaptic connections (there are only an estimated 100–400 billion stars in the Milky Way galaxy).
Efforts are currently underway to map the connectome at a number of levels, from the relatively coarse resolution of diffusion MRI to the subcellular level of electron microscopy. That’s a story for another day, but if you’re interested in this topic, I highly recommend Sebastian Seung’s eminently readable 2012 book, Connectome: How the Brain’s Wiring Makes Us Who We Are.

Back to the Allen Institute datasets. When you click on ‘Mouse Connectivity’, the site presents you with an index of injection sites, 47 in all. Let’s click on “visual areas.” The next page that comes up is a list of datasets that include that region. For the sake of this example, let’s click on the first entry in that list, “Primary visual area,” experiment #100141219.
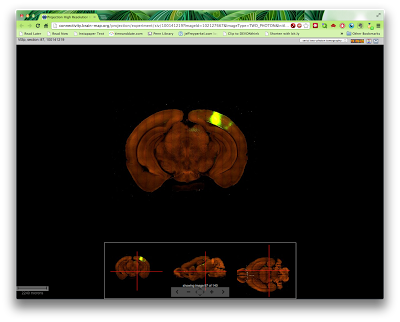
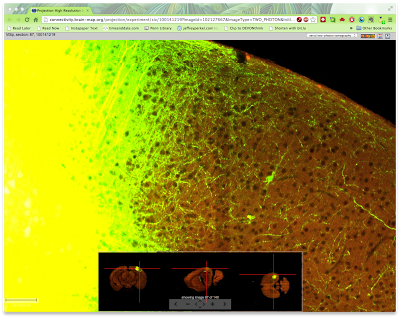
The resulting page contains 140 fluorescent images of brain tissue slices in shades of orange and green. Click one to see it enlarged. Orange areas are non-fluorescent – they didn’t take up the tracer, meaning they are not physically connected to the injection site. On the bottom of the window is a series of navigation tools – you can tiptoe through the thalamus if you’d like, simply by moving these sliders left-right, up-down, and front-back. Just like a real neuroscientist!
 

This is your brain (well, a mouse brain) on rAAV (a fluorescent tracer).
(Source)

You can also zoom in to the cellular level. Here’s a close-up of a densely fluorescent area of the mouse brain — you can actually see individual neurons in this view.
 

This is a closeup of your brain on rAAV. (Again, if you were a mouse)
(Source)

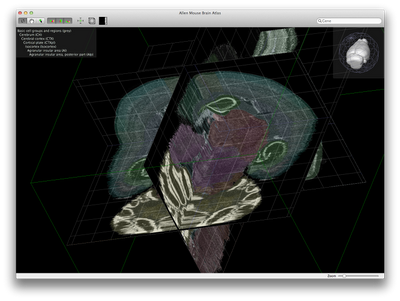
Another option is to download the Allen Institute’s free Brain Explorer software, a standalone program that lets you view these data offline. With Brain Explorer you can “step” through the brain slice by slice, rotate it, highlight regions. It’s way cool, even if (like me) you don’t know very much about brain anatomy.
Here’s a screenshot from the application, showing gene expression data in the center of the brain.
 

Screenshot of the Allen Institute’s Brain Explorer software

If you’re interested in how the amazing researchers at the Allen Institute are doing this work, they lay it out for you in a nice series of white papers (here’s the one on the mouse connectivity mapping project). I recommend you take a look!
 
The opinions expressed in this post do not necessarily reflect or conflict with those of the DXS editorial team or contributors.

An antibody therapy for hemophilia A?

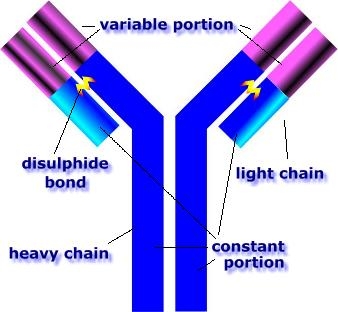
Example of an antibody. The interesting bits are purple,
as so many interesting things are.
Image credit and license info, via Wikimedia Commons.

By Jeffrey Perkel, DXS tech editor

Last night on TV I caught an ad for Humira, Abbott Laboratories’ prescription medication for a series of conditions including rheumatoid arthritis, psoriatic arthritis, and Crohn’s disease.


The ad noted that, like all drugs, this medication actually has two names, its brand name (Humira), and its generic name, adalimumab. That suffix, -mab, indicates that Humira is a monoclonal antibody, a large protein normally produced by your immune system’s B cells to recognize and eliminate proteins and pathogens that are not “self.” In particular, Humira recognizes, binds, and inactivates the protein called “tumor necrosis factor,” or TNF, which is implicated in various autoimmune disorders.


There are dozens of monoclonal antibody drugs on the market now, including the breast cancer therapeutic Herceptin (trastuzumab), Remicade (infliximab) for autoimmune disorders, and Rituxan (rituximab) for non-Hodgkin lymphoma.(*) In most cases, by binding specific proteins, either in solution or on cell surfaces, these molecules either inactivate proteins (as in the case of TNF), target the cell for death, or block inappropriate cell signaling (as in Herceptin). Other antibody designs use the antibody as a “guided missile,” targeting drug or radioisotope “warheads” to cancerous cells.


On Sept. 30, though, a team of Japanese researchers at Chugai Pharmaceutical, reported an example of a new kind of antibody application, and it’s pretty slick.


The paper concerns a novel treatment concept for hemophila A, an X-linked recessive bleeding disorder that affects about 1 in 10,000 men. It is caused by a lack of a clotting protein called factor VIII (FVIII), and the typical treatment is “prophylactic supplementation” of the missing protein.


There are three problems with that treatment, as the paper notes. First, FVIII is expensive. It also must be administered frequently and intravenously, which is especially difficult for pediatric patients and “negatively affects both the implementation of and adherence to the supplementation routine.” But perhaps most significantly, in about 30% of cases the body recognizes the recombinant FVIII as “non-self” or “foreign,” and develops antibodies (“inhibitors”) to inactivate it, rendering the treatment ineffective.


To circumvent that problem, the Chugai team developed what is called a “bispecific antibody” to replace FVIII. So what is a bispecific antibody?


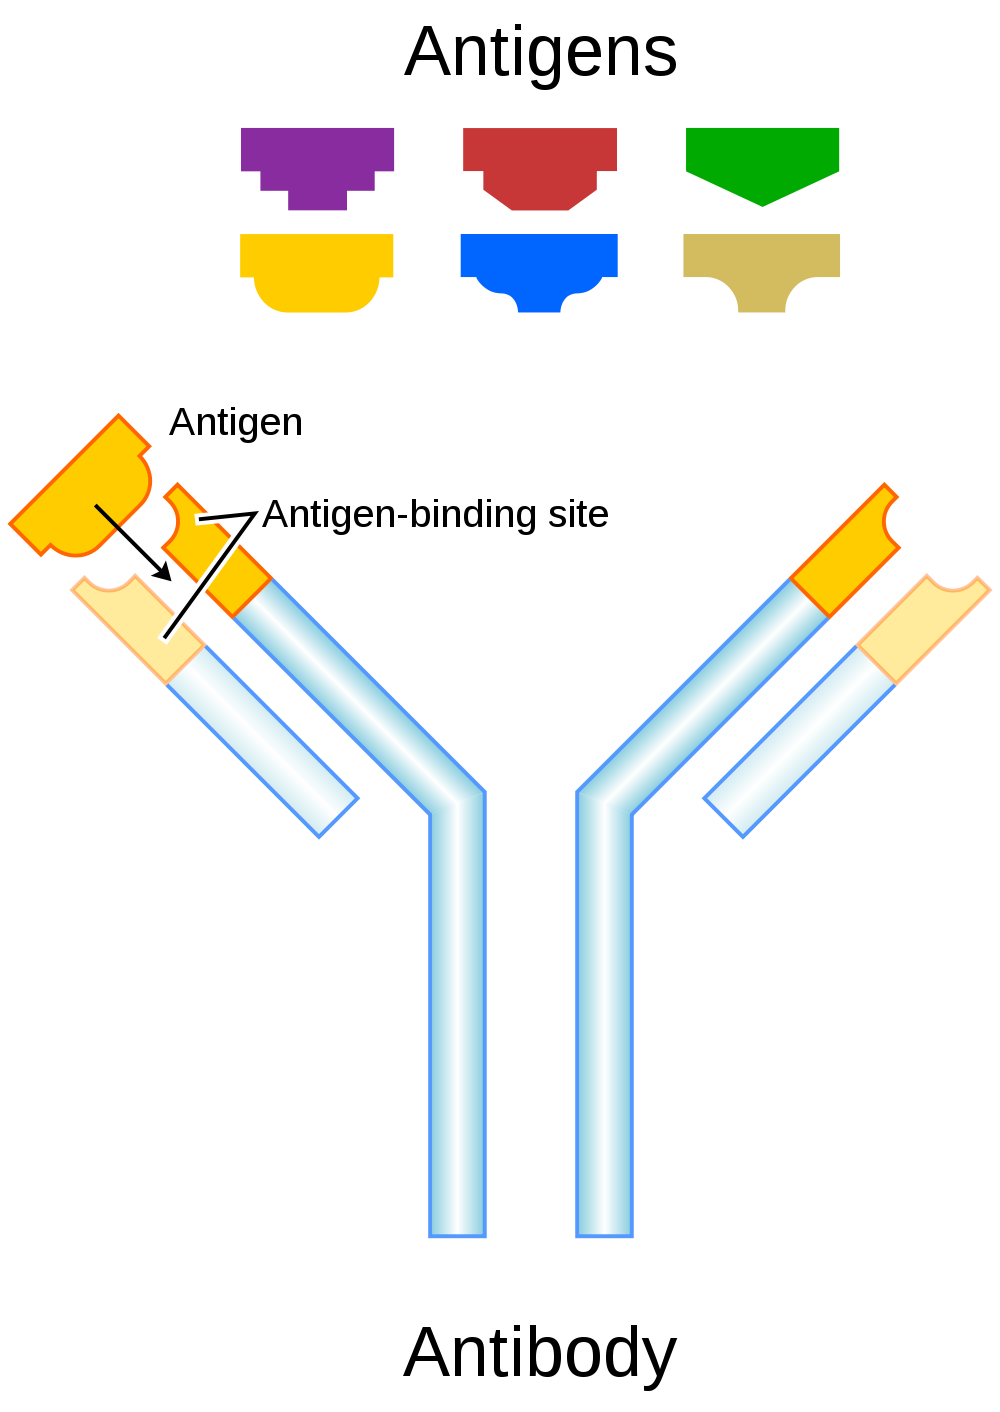
In cartoon form, antibodies resemble the letter Y, with antigen-binding regions at the tip of either branch. In a normal antibody, those two binding regions are identical, such that each antibody can bind two copies of the same protein molecule.


A standard monoclonal antibody has two binding arms, each recognizing the same antigen (protein target).
Source: Wikipedia, http://en.wikipedia.org/wiki/Antibody

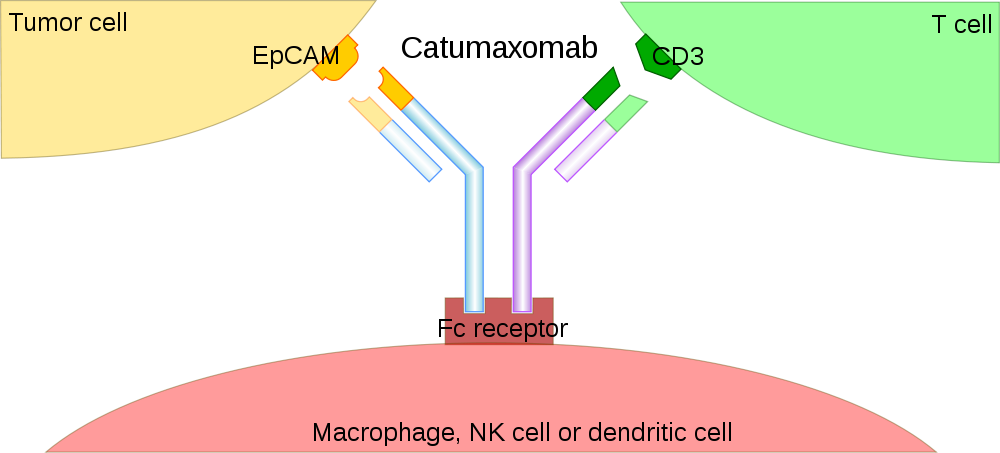
A bispecific antibody, though, has two different binding domains, one for each of two proteins, such that it can effectively act as a scaffold to bring two proteins – or the cells they are attached to – together. The only bispecific currently on the market, Trion Pharma’s Removab, acts to couple immune system T cells and macrophages to tumors.

A bispecific antibody, Trion’s Removab.
Source: Wikipedia, http://en.wikipedia.org/wiki/Bispecific_monoclonal_antibody

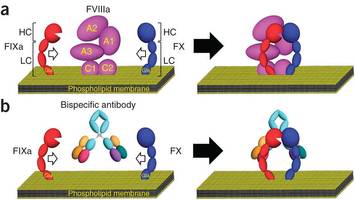
Chugai’s scientists developed a bispecific antibody that does something different. Their antibody, called hBS23, links two other clotting factors, FIXa and FX, thereby mimicking the function and architecture of the missing FVIII without actually administering it.

FVIII activates FX in the presence of FIXa. hBS23 is a bispecific antibody that replaces FVIII.
(c) 2012 Nature Publishing Group [Nature Medicine, doi:10.1038/nm.2942]

In test tube clotting assays, hBS23 was about 14-times less catalytically efficient than FVIII itself, yet could nevertheless induce clotting, even in cases where the plasma contained inhibitors against FVIII. (Recombinant human FVIII had no effect in those latter cases.) In a non-human primate model of hemophilia A, hBS23 prevented development of anemia and reduced internal bleeding comparable to FVIII itself.


Significantly, hBS23 lasts a long time in the primate bloodstream – with an IV half-life of 14 days and comparable subcutaneously bioavailability – yet seems unlikely to elicit inhibitory antibodies of its own. That subcutaneous activity is significant, as regular subcu administration should be more easily tolerated than an IV.

Based on the these studies, and some simulations, the authors predict that “once weekly dosing of 1 mg per kg body weight of hBS23 would show a continuous hemostatic effect in humans.”

Of course, that’s just a prediction. The proof of the pudding is in the eating, as they say, and only time will tell how hBS23 will fare in people. But don’t look for it on pharmacy shelves any time soon. Clinical trials take time, and further optimization of the antibody design is likely required. Still, the team is obviously upbeat about their strategy’s potential:


“A long-acting, subcutaneously injectable agent that is unaffected by the presence of inhibitors could markedly reduce the burden of care for the treatment of hemophilia A.”


For more details, you can read the report here.

——————————————————
We’ve also got a partner post for you, an antibody explainer by our very own Jeanne Garbarino. Be sure to check it out!


*Fun fact: If you’ve ever wondered about how drugs get their generic names, they are conferred by the US Adopted Names Council. The names have a kind of prefix/stem structure, linking a manufacturer-supplied but meaningless prefix (adalimu–) with a specific stem (eg, –mab) that denotes the drug class or activity. There are literally hundreds of stems, including –coxib (COX2 inhibitors), –vir (antivirals), and –stat (enzyme inhibitors); for a complete list, click here.

Towards better drug development, fewer side effects?

You may have had the experience: A medication you and a friend both take causes terrible side effects in you, but your friend experiences none. (The running joke in our house is, if a drug has a side-effect, we’ve had it.) How does that happen, and why would a drug that’s meant to, say, stabilize insulin levels, produce terrible gastrointestinal side effects, too? A combination of techy-tech scientific approaches might help answer those questions for you — and lead to some solutions.

It’s no secret I love lab technology. I’m a technophile. A geek. I call my web site “Biotechnically Speaking.” So when I saw this paper in the September issue of Nature Biotechnology, well, I just had to write about it.

The paper is entitled, “Multiplexed mass cytometry profiling of cellular states perturbed by small-molecule regulators.” If you read that and your eyes glazed over, don’t worry –- the article is way more interesting than its title.

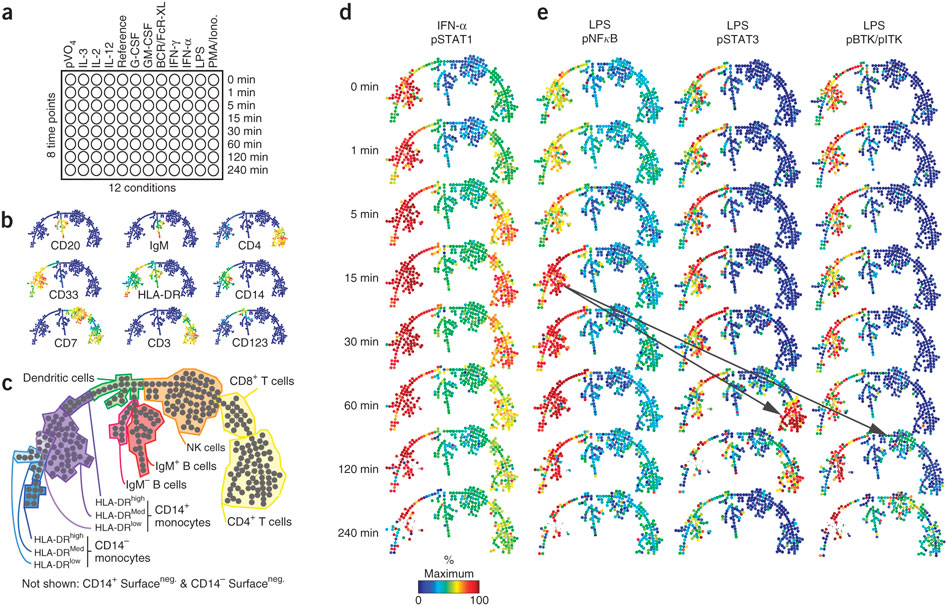
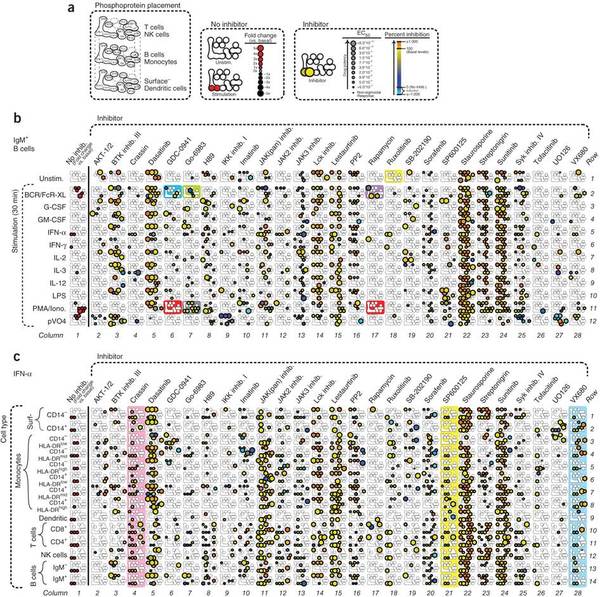
Those trees on the right are called SPADE trees. They map cellular responses to different stimuli in a collection of human blood cells. Credit: (c) 2012 Nature America [Nat Biotechnol, 30:858-67, 2012]
Here’s the basic idea: The current methods drug developers use to screen potential drug compounds –- typically a blend of high-throughput imaging and biochemical assays – aren’t perfect. If they were, drugs wouldn’t fail late in development. Stanford immunologist Garry Nolan and his team, led by postdoc Bernd Bodenmiller (who now runs his own lab in Zurich), figured part of that problem stems from the fact that most early drug testing is done on immortalized cell lines, rather than “normal” human cells. Furthermore, the tests that are run on those cells aren’t as comprehensive as they could be, meaning potential collateral effects of the compounds might be missed. Nolan wanted to show that flow cytometry, a cell-analysis technique frequently used in immunology labs, can help reduce that failure rate by measuring drug impacts more holistically.


Nolan is a flow cytometry master. As he told me in 2010, he’s been using the technique for more than three decades, and even used a machine now housed in the Smithsonian.


In flow cytometry, researchers treat cells with reagents called antibodies, which are immune system proteins that recognize and bind to specific proteins on cell surfaces. Each type of cell has a unique collection of these proteins, and by studying those collections, it is possible to differentiate and count the different populations.


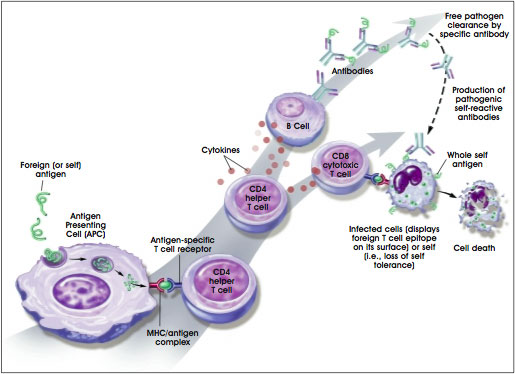
Suppose researchers wanted to know how many T cells of a specific type were present in a patient’s blood. They might treat those cells with antibodies that recognize a protein known as CD3 to pick those out. By adding additional antibodies, they can then select different T-cell subpopulations, such as CD4-positive helper T cells and CD8-positive cytotoxic T cells, both of which help you mount immune responses.


Cells of the immune system
Source: http://stemcells.nih.gov/info/scireport/chapter6.asp
In a basic flow cytometry experiment, each antibody is labeled with a unique fluorescent dye –- the antibody targeting CD3 might be red, say, and the CD4 antibody, green. The cells stream past a laser, one by one. The laser (or lasers –- there can be as many as seven) excites the dye molecules decorating the cell surface, causing them to fluoresce. Detectors capture that light and give a count of how many total cells were measured and the types of cells. The result is a kind of catalog of the cell population. For immune cells, for example, that could be the number of T cells, B cells (which, among other things, help you “remember” previous invaders), and macrophages (the big cells that chomp up invaders and infected cells). By comparing the cellular catalogs that result under different conditions, researchers gain insight into development, disease, and the impact of drugs, among other things.


But here’s the problem: Fluorescent dyes aren’t lasers, producing light of exactly one particular color. They absorb and emit light over a range of colors, called a spectrum. And those spectra can overlap, such that when a researcher thinks she’s counting CD4 T cells, she may actually be counting some macrophages. That overlap leads to all sorts of experimental optimization issues. An exceptionally talented flow cytometrist can assemble panels of perhaps 12 or so dyes, but it might take months to get everything just right.


That’s where the mass cytometry comes in. Commercialized by DVS Sciences, mass cytometry is essentially the love-chid of flow cytometry and mass spectrometry, combining the one-cell-at-a-time analysis of the former with the atomic precision of the latter. Mass spectrometry identifies molecules based on the ratio of their mass to their charge. In DVS’ CyTOF mass cytometer, a flowing stream of cells is analyzed not by shining a laser on them, but by nuking them in superhot plasma. The nuking reduces the cell to its atomic components, which the CyTOF then measures.

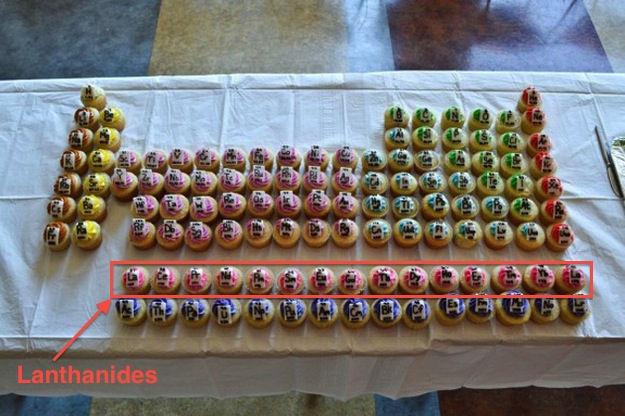
Specifically, the CyTOF looks for heavy atoms called lanthanides, elements found in the first of the two bottom rows of the periodic table, like gadolinium, neodymium, and europium. These elements never naturally occur in biological systems and so make useful cellular labels. More to the point, the mass spectrometer is specific enough that these signals basically don’t overlap. The instrument will never confuse gadolinium for neodymium, for instance. Researchers simply tag their antibodies with lanthanides rather than fluorophores, and voila! Instant antibody panel, no (or little) optimization required.

Periodic Table of Cupcakes, with lanthanides in hot pink frosting.
Source: http://www.buzzfeed.com/jpmoore/the-periodic-table-of-cupcakes
Now back to the paper. Nolan (who sits on DVS Sciences’ Scientific Advisory Board) and Bodenmiller wanted to see if mass cytometry could provide the sort of high-density, high-throughput cellular profiling that is required for drug development. The team took blood cells from eight donors, treated them with more than two dozen different drugs over a range of concentrations, added a dozen stimuli to which blood cells can be exposed in the body, and essentially asked, for each of the pathways we want to study, in each kind of cell in these patients’ blood, what did the drug do?


To figure that out, they used a panel of 31 lanthanides –- 10 to sort out the cell types they were looking at in each sample, 14 to monitor cellular signaling pathways, and 7 to identify each sample.


I love that last part, about identifying the samples. The numbers in this experiment are kind of staggering: 12 stimuli x 8 doses x 14 cell types x 14 intracellular markers per drug, times 27 drugs, is more than half-a-million pieces of data. To make life easier on themselves, the researchers pooled samples 96 at a time in individual tubes, adding a “barcode” to uniquely identify each one. That barcode (called a “mass-tag cellular barcode,” or MCB) is essentially a 7-bit binary number made of lanthanides rather than ones and zeroes: one sample would have none of the 7 reserved markers (0000000); one sample would have one marker (0000001); another would have another (0000010); and so on. Seven lanthanides produce 128 possible combinations, so it’s no sweat to pool 96. They simply mix those samples in a single tube and let the computer sort everything out later.


This graphic summarizes a boatload of data on cell signaling pathways impacted by different drugs.
Credit: (c) 2012 Nature America [Nat Biotechnol, 30:858-67, 2012]
When all was said and done, the team was able to draw some conclusions about drug specificity, person-to-person variation, cell signaling, and more. Basically, and not surprisingly, some of the drugs they looked at are less specific than originally thought -– that is, they affect their intended targets, but other pathways as well. That goes a long way towards explaining side effects. But more to the point, they proved that their approach may be used to drive drug-screening experiments.


And I get to write about it.

Drill, baby, drill — microbial-style

Could the oil energy needed to light up this drill
come directly from soil bacteria instead of the soil?
Image credit: Obakeneko; via Wikimedia Commons

By Jeffrey Perkel, DXS tech editor

It’s no secret that America’s petroleum addiction is a problem in need of a solution. “Drill, baby, drill” notwithstanding, this country eventually will have to find a way to survive without low-cost oil – or at least, find another way to make it.

A recent MIT press release suggests one route to energy independence: soil bacteria. The release, Teaching a microbe to make fuel,” details a recent study from MIT graduate student Jingnan Lu, research scientist Christopher Brigham, and their lab director, Anthony Sinskey.

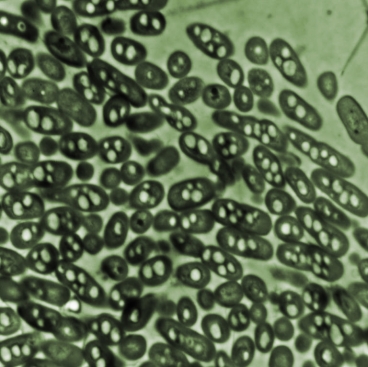
What Brigham, Lu, and their colleagues did was convince a soil bacterium called Ralstonia eutropha to turn carbon into gasoline –- specifically, the four-carbon molecules iso-butanol and 3-methyl-1-butanol.


Ralstonia eutropha bacteria in culture
How’d they do that? It was a simple matter of microbial engineering. As detailed in MIT’s description:
… in the microbe’s natural state, when its source of essential nutrients such as nitrate or phosphate is restricted, “it will go into carbon-storage mode,” [Brigham says,] essentially storing away food for later use when it senses that resources are limited.
“What it does is take whatever carbon is available, and stores it in the form of a polymer, which is similar in its properties to a lot of petroleum-based plastics,” Brigham says. By knocking out a few genes, inserting a gene from another organism and tinkering with the expression of other genes, Brigham and his colleagues were able to redirect the microbe to make fuel instead of plastic.

That last sentence makes the process sound easier than it was. It took a full year of work to effect that transformation, Brigham tells me, and no wonder: Bacteria don’t normally make gasoline. But they do make amino acids, the protein building blocks that all living things need to survive. The team realized that Ralstonia bacteria create one particular group of amino acids (the so-called branched-chain amino acids) using chemical intermediates that they could coopt to turn sugar into fuel.


To realize that potential, Brigham and his colleagues first had to get Ralstonia to refocus its energies, literally. When stressed, the bacteria store carbon in a polymer-a chain of molecules-called PHB. The bacterium executes this particular biochemical program extremely effectively, cranking out enough polymer to account for more than 80% of the cell’s mass. Brigham and Lu had to redirect that enzymatic zeal towards gasoline instead. So, they knocked out the genes involved in building PHB.


Next, they added some missing chemical pieces. I said earlier that the branched-chain amino acid pathway includes an intermediate that could be used to make gasoline. To do that, the cells need a missing bit of hardware — specifically, an enzyme to convert that chemical intermediate into something the gasoline-making enzymes can use. That enzyme is called KIVD, and Ralstonia does not make it. But another bacterium, Lactococcus lactis, does make it. Brigham and Lu borrowed the related bit of genetic material from Lactococcus lactis, expressed it in Ralstonia, and –- not much happened.

As University of California, Berkeley, biochemical engineer Jay Keasling explained to me, the cell in such situations is literally a chemical factory. For the factory to run smoothly, all the factory workers –- the enzymes -– need to be fully engaged at the right time. That won’t happen if one enzyme is cranking out lots of its product but others are not. Intermediate products will start piling up, reducing efficiency and potentially poisoning the cell.


In this case, with KIVD, the cells had all the necessary pieces to make gasoline. But they weren’t producing them at the same levels. In other words, the factory had more workers at one part of the assembly line than at others. As a result, productivity was relatively low (about 10 mg isobutanol per liter of culture). To boost that output, the researchers dialed up expression levels of several proteins to get them all in sync. They also shut down a handful of other chemical assembly lines, too, “carbon sinks” that could siphon off intermediates.


When all was said and done, the cells could produce about 310 mg of gasoline per liter of culture. That gas conveniently drifts into the culture medium surrounding the cells, from which it is easily extracted. Now, says Brigham, the trick is optimizing the process.


In the meantime, others are working towards the same goal. Researchers have considerable experience getting bacteria and yeast to produce compounds they don’t normally make — the antimalarial drug artemisinin, for instance -– and microbial biofuel development is a research target at the Joint BioEnergy Institute (headed by Keasling), Synthetic Genomics, and LS9, among other places.


Often, those biofuel strategies rely on plants to produce their starting materials. And that’s the really cool part about Sinskey’s work: Ralstonia can eat almost anything, Brigham says, from carbon dioxide and organic acids to fatty acids and sugar. Brigham envisions coupling these organisms to waste streams, such that they can suck out the nutrients and turn them into fuel, no plants required.


Garbage in, fuel out: Now that’s a microbial trick I can get behind.


(If you’re interested, you can read Brigham and Lu’s work here.)


Image: Christopher Brigham / http://web.mit.edu/newsoffice/2012/genetically-modified-organism-can-turn-carbon-dioxide-into-fuel-0821.html